

The Christmas of Fresh Flowers

FIELD JOURNAL:Minnesota in the winter of 1877 experienced temperatures 10 to 15 degrees above average. This anomaly had gardens producing flowers and rivers were passing cargo via barge—usually a transit route cut off in October.
The winter of 1877–78 sits inside what's now considered the strongest El Niño event in roughly eight hundred years of tree-ring reconstructed record—a statistical dead heat with 2015–16 for the title, depending on the reconstruction used. The mechanism was an unusually long cool phase in the tropical Pacific from 1870 to 1876, allowing an immense buildup of warm water in the western Pacific, which then discharged first as a strong La Niña in 1875–76 and then swung, hard, into the extreme El Niño that peaked the following year.
The global consequence is now generally called the Great Drought, and it produced simultaneous, severe famine across three continents. Estimates vary by an order of magnitude depending on source and method — the low end puts China's Northern famine at roughly 9.5 million dead and India's at roughly 6 million, while a 2018 Journal of Climate reconstruction puts the global total above 50 million. Brazil's Nordeste lost perhaps half a million. The spread in the numbers isn't just poor record-keeping—it's partly the key subject of Mike Davis's Late Victorian Holocausts, which argues the climate shock alone doesn't explain the mortality. Colonial administration does a lot of the remaining work: British India kept exporting grain throughout the famine—a record 6.4 million hundredweight of wheat left for England during the worst of it—and railways built for market integration moved food out of drought districts rather than into them, with mortality documented as higher, not lower, in the districts the railways served.
The same year in the United States, the Compromise of 1877 ended Reconstruction: the deal that resolved the disputed Hayes–Tilden election by withdrawing federal troops from the South in exchange for national political stability. It's usually read, structurally, as the opening of a "High" in Strauss and Howe's generational framework—a period defined by institutional rebuilding after the Civil War's Crisis, bought in this case by abandoning the unfinished project of Reconstruction-era civil rights. Theodore Roosevelt entered Harvard that same fall, seventeen years old, part of what Strauss and Howe categorize as the Progressive Generation—a cohort they describe as cautious, consensus-seeking, expertise-oriented. TR himself is closer to the exception the theory has to explain than the rule it predicts.
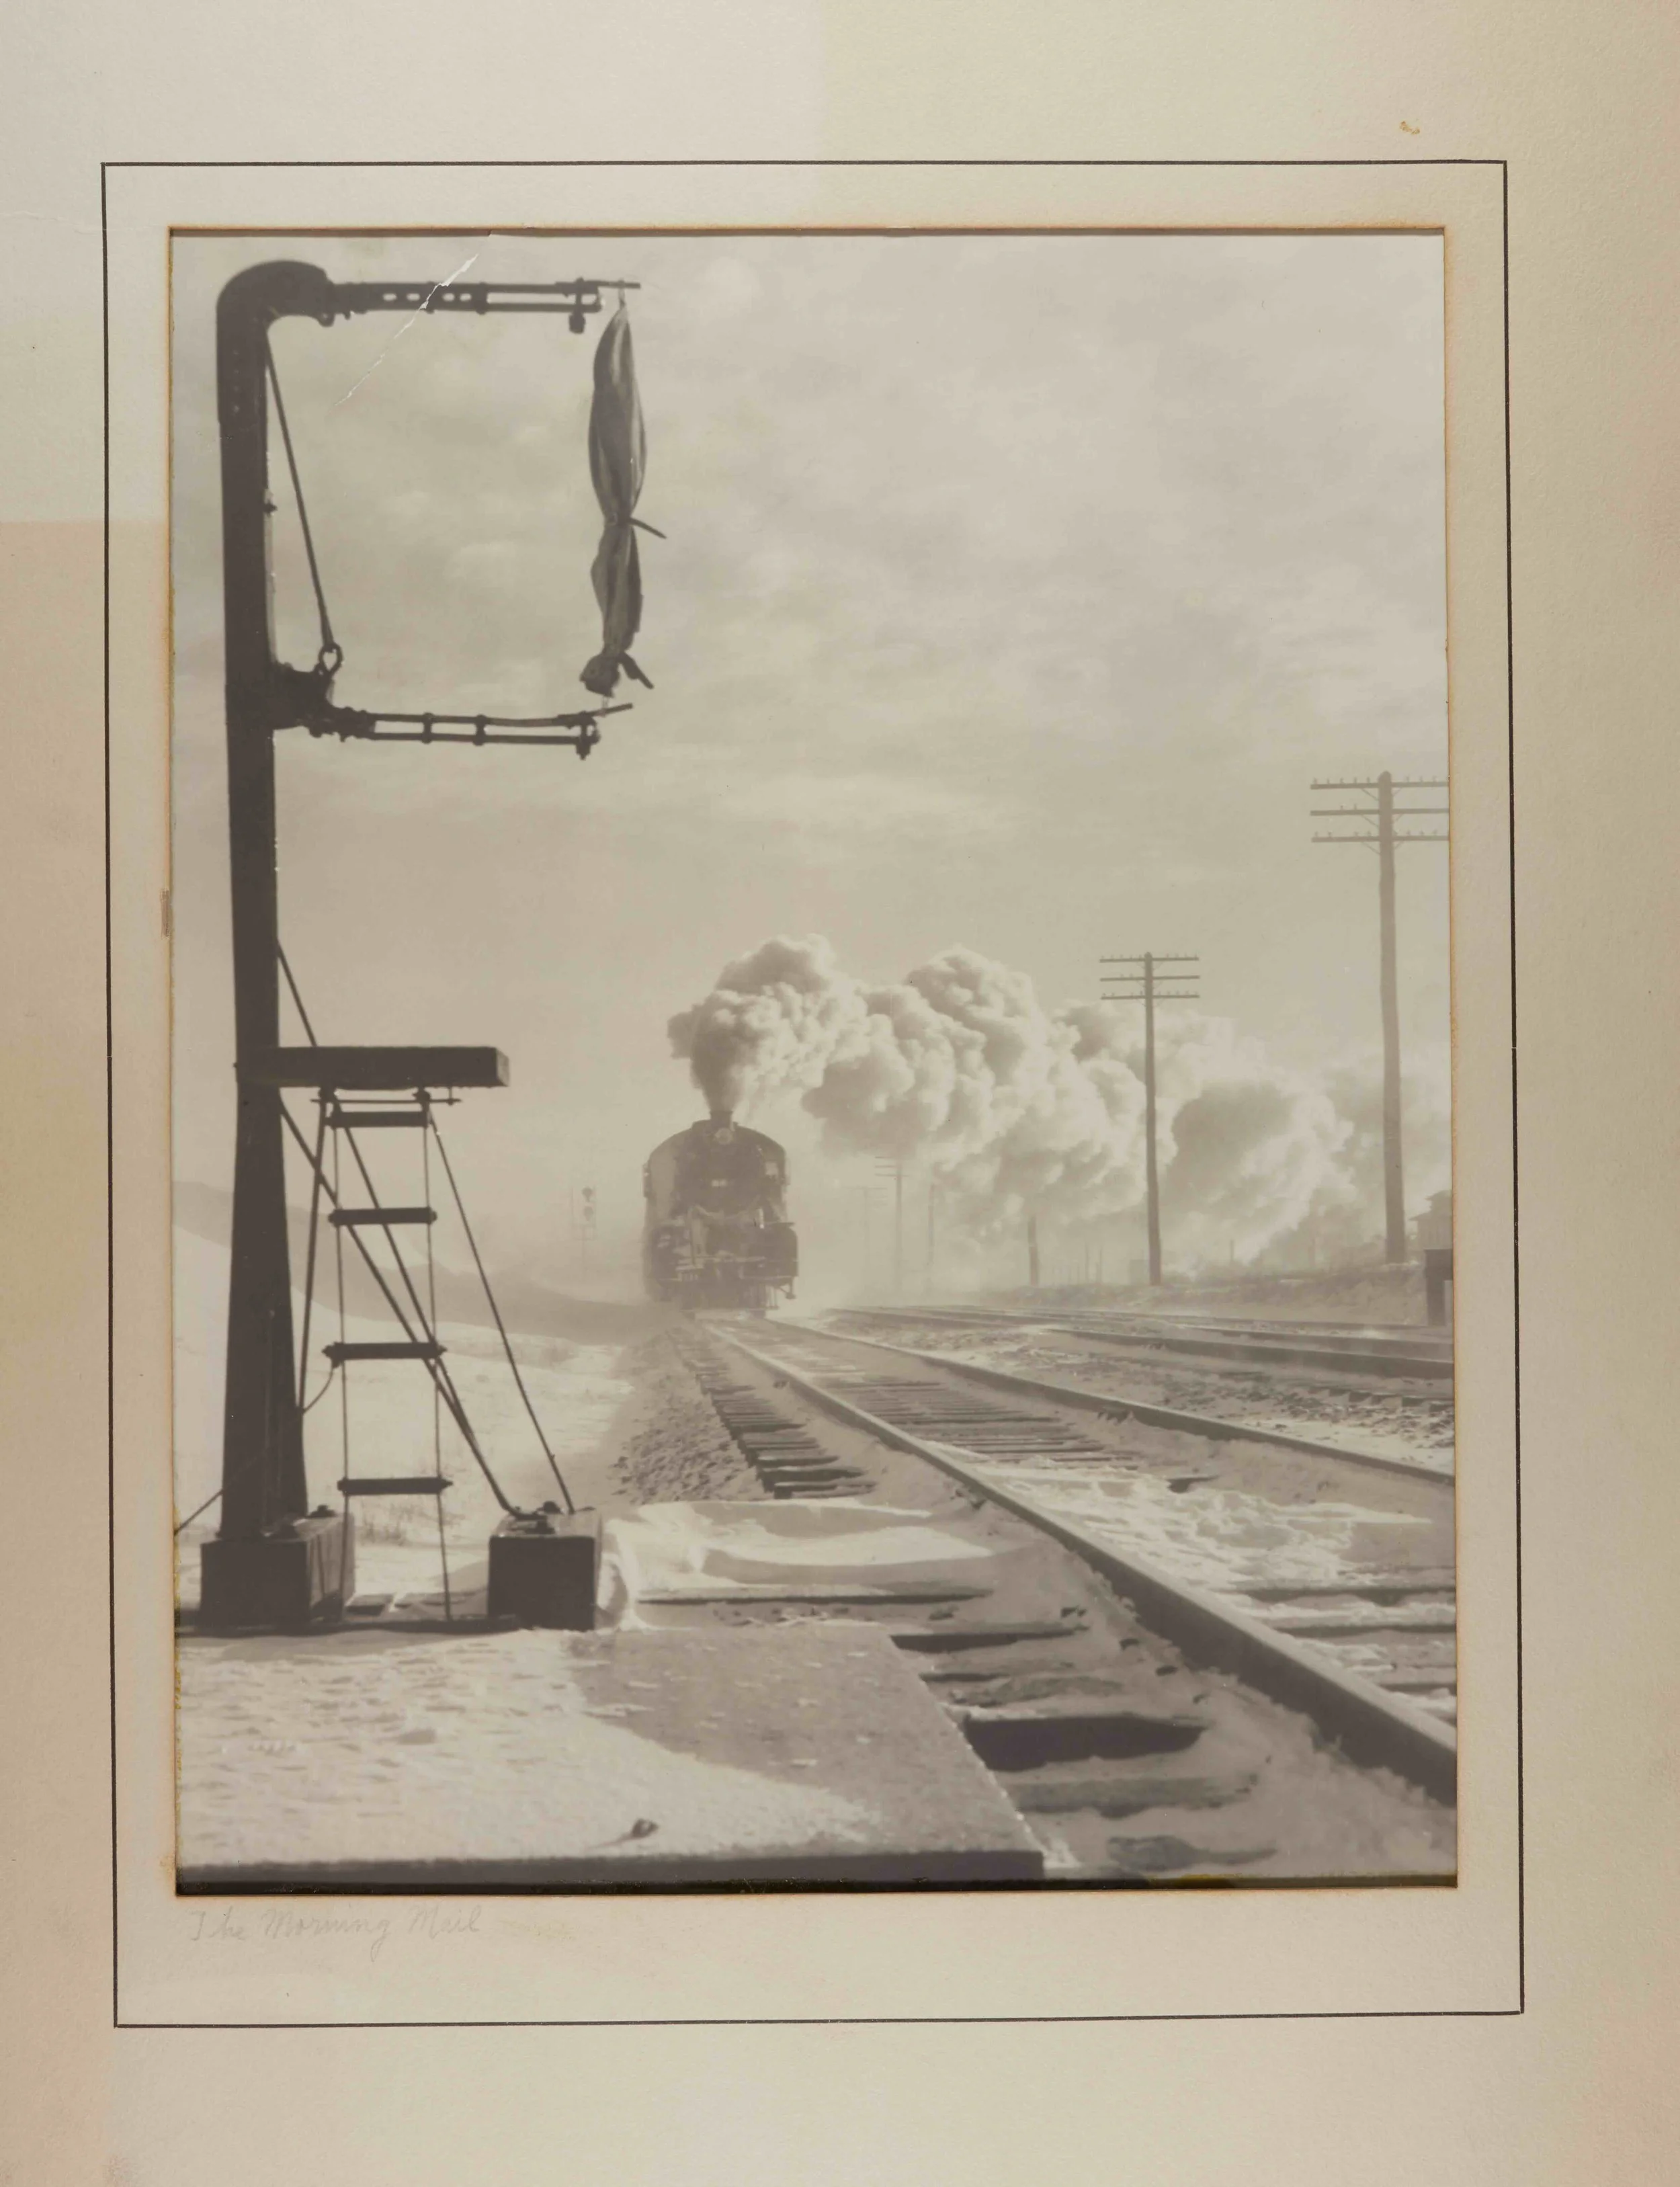
Photograph of the Morning Mail Train
NAID: 547587590
What Minnesota locals felt
The most exact record comes from William Cheney, the era's official weather observer, whose monthly reports ran in the Minneapolis Tribune. December 1877: "Unprecedented, untimely, unpleasant and sub-boreal weather... Farmers plowing as late as the 23rd... Flowers blooming on the 28th... Sleighing entirely gone by mid month with roads almost impassible because of mud." By February: "This month closes the most remarkable winter ever known in Minnesota… a mean temperature ten degrees warmer than any winter of which I have any record." By March, the observation had turned almost wry: "This was decidedly the warmest March of which I have any record... twelve degrees warmer than the average of 33 years."
The St. Paul Pioneer Press was less measured. December 22nd: "the bottom is said to be terribly out of roads in different localities," followed by an actual instruction to readers "down with storm and sash and up with mosquito bars" take down the storm windows, put up the screens, in December. The next day: "frogs and spotted snakes are now found hopping and crawling around marshes in the vicinity" amphibians and reptiles active two days before Christmas, in Minnesota. By March, the paper's own weather column noted the whole season had inverted: "the first day of spring, in theory, but in fact we have had the first days of spring nearly all winter."
Minnesota's own record calls the whole season the Year Without a Winter. Soil never froze deeper than four to six inches. Farmers were sowing wheat by February 20th, weeks ahead of any normal planting date. Lake Minnetonka's ice went out March 11th, the earliest date on record, thirty-five days ahead of its median. The Mississippi at St. Paul, having barely frozen at all, reopened for navigation by February 28th, more than a full month earlier than usual.
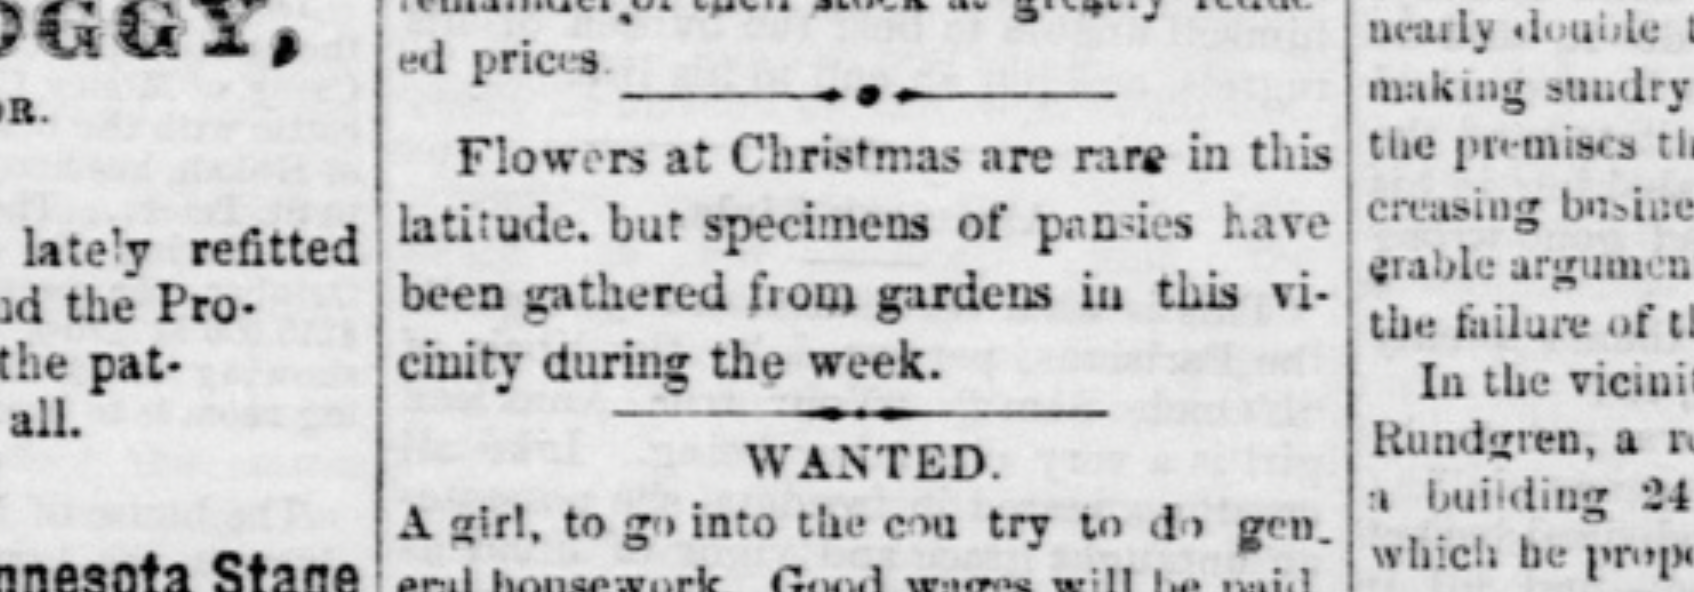
The Moorhead Advocate
Dec 29 1877 • Moorhead, Clay, Minnesota, USA
How it was measured
The instinct is to assume a shock this large should show up cleanly in the economic record. It mostly doesn't. And where it does, it's not where you’d predict.
U.S. pig iron production, monthly, from a series the NBER's Macaulay compiled in 1938, barely moves through 1877, dips again through most of 1878, and only breaks upward hard in the second half of 1879, nearly doubling from January to December that year. It's the tail end of the Long Depression, the longest contraction on the NBER's books (October 1873 to March 1879, sixty-five months), with unemployment peaking around 8.25% in 1878. The Year Without a Winter sits almost exactly at the bottom of that trough, not the top. Zoomed out to 1840–1900, the same window barely registers—a small stumble on a curve about to go nearly vertical, production climbing roughly forty-fold over the following two decades.
National railroad gross earnings tell a stranger story. December 1877 through March 1878 shows the usual seasonal winter dip—but the size of that dip, year over year, sits squarely in the middle of the normal range, no larger and no smaller than an ordinary winter. Two effects were likely canceling out: trains themselves probably ran more smoothly with almost no snow to fight, but the muddy, frozen-rutted wagon roads that fed grain to the depots made it harder for farmers to actually get freight onto the trains in the first place, and railroads lost a chunk of their usual winter monopoly early, since the rivers that would normally keep steamboat competition frozen out reopened weeks ahead of schedule. Even a historically unprecedented winter, it turns out, can net out to nothing at the aggregate level once enough offsetting mechanisms are in play. That's a better lesson for a strategist than a dramatic chart would have been.
River traffic, December 1877
A special telegram to the St. Paul Pioneer Press, filed from La Crosse, Wisconsin on December 26th, reported that the Mississippi was free of ice and open to navigation—the first time that had happened in December in the city's recorded history. Steamboats and ferries were running regular trips. Logging crews on the Black River were driving logs, which the dispatch calls "an unheard-of occurrence during winter months." The same wire noted, almost as an aside, that the roads were "already most deplorable," and that the whole region was hoping for frost before snow arrived, because mud without a freeze underneath it was worse than either extreme alone.
The companion dispatch from Winona, same day, same wire, is the one that's stayed with me longest: "the remarkable mildness of the weather elicited remarks and confessions from the oldest inhabitants that they had never seen anything like it." Nobody in that room had a word for what was happening to them. They reached for the only instrument available—ask whoever's lived here longest—and even that instrument came back registering something outside its own range.
A third dispatch, from further up the St. Croix, logged two barges carrying 450 barrels of flour floating downriver from Osceola, departing at 2:30 in the morning and arriving that afternoon—a commercial shipment, on a river that should have been frozen solid. The wire operator added a line that reads almost like he couldn't quite let it go past without remark: "Keep the fact in mind that it was on the 25th of December, too."
Four independent reports, one river system, one week, none of them aware of the others, none of them able to see the six years of thermal buildup that had made any of it possible. Just people noticing, in real time, that the ground rules had changed, without the tools to say by how much or why.
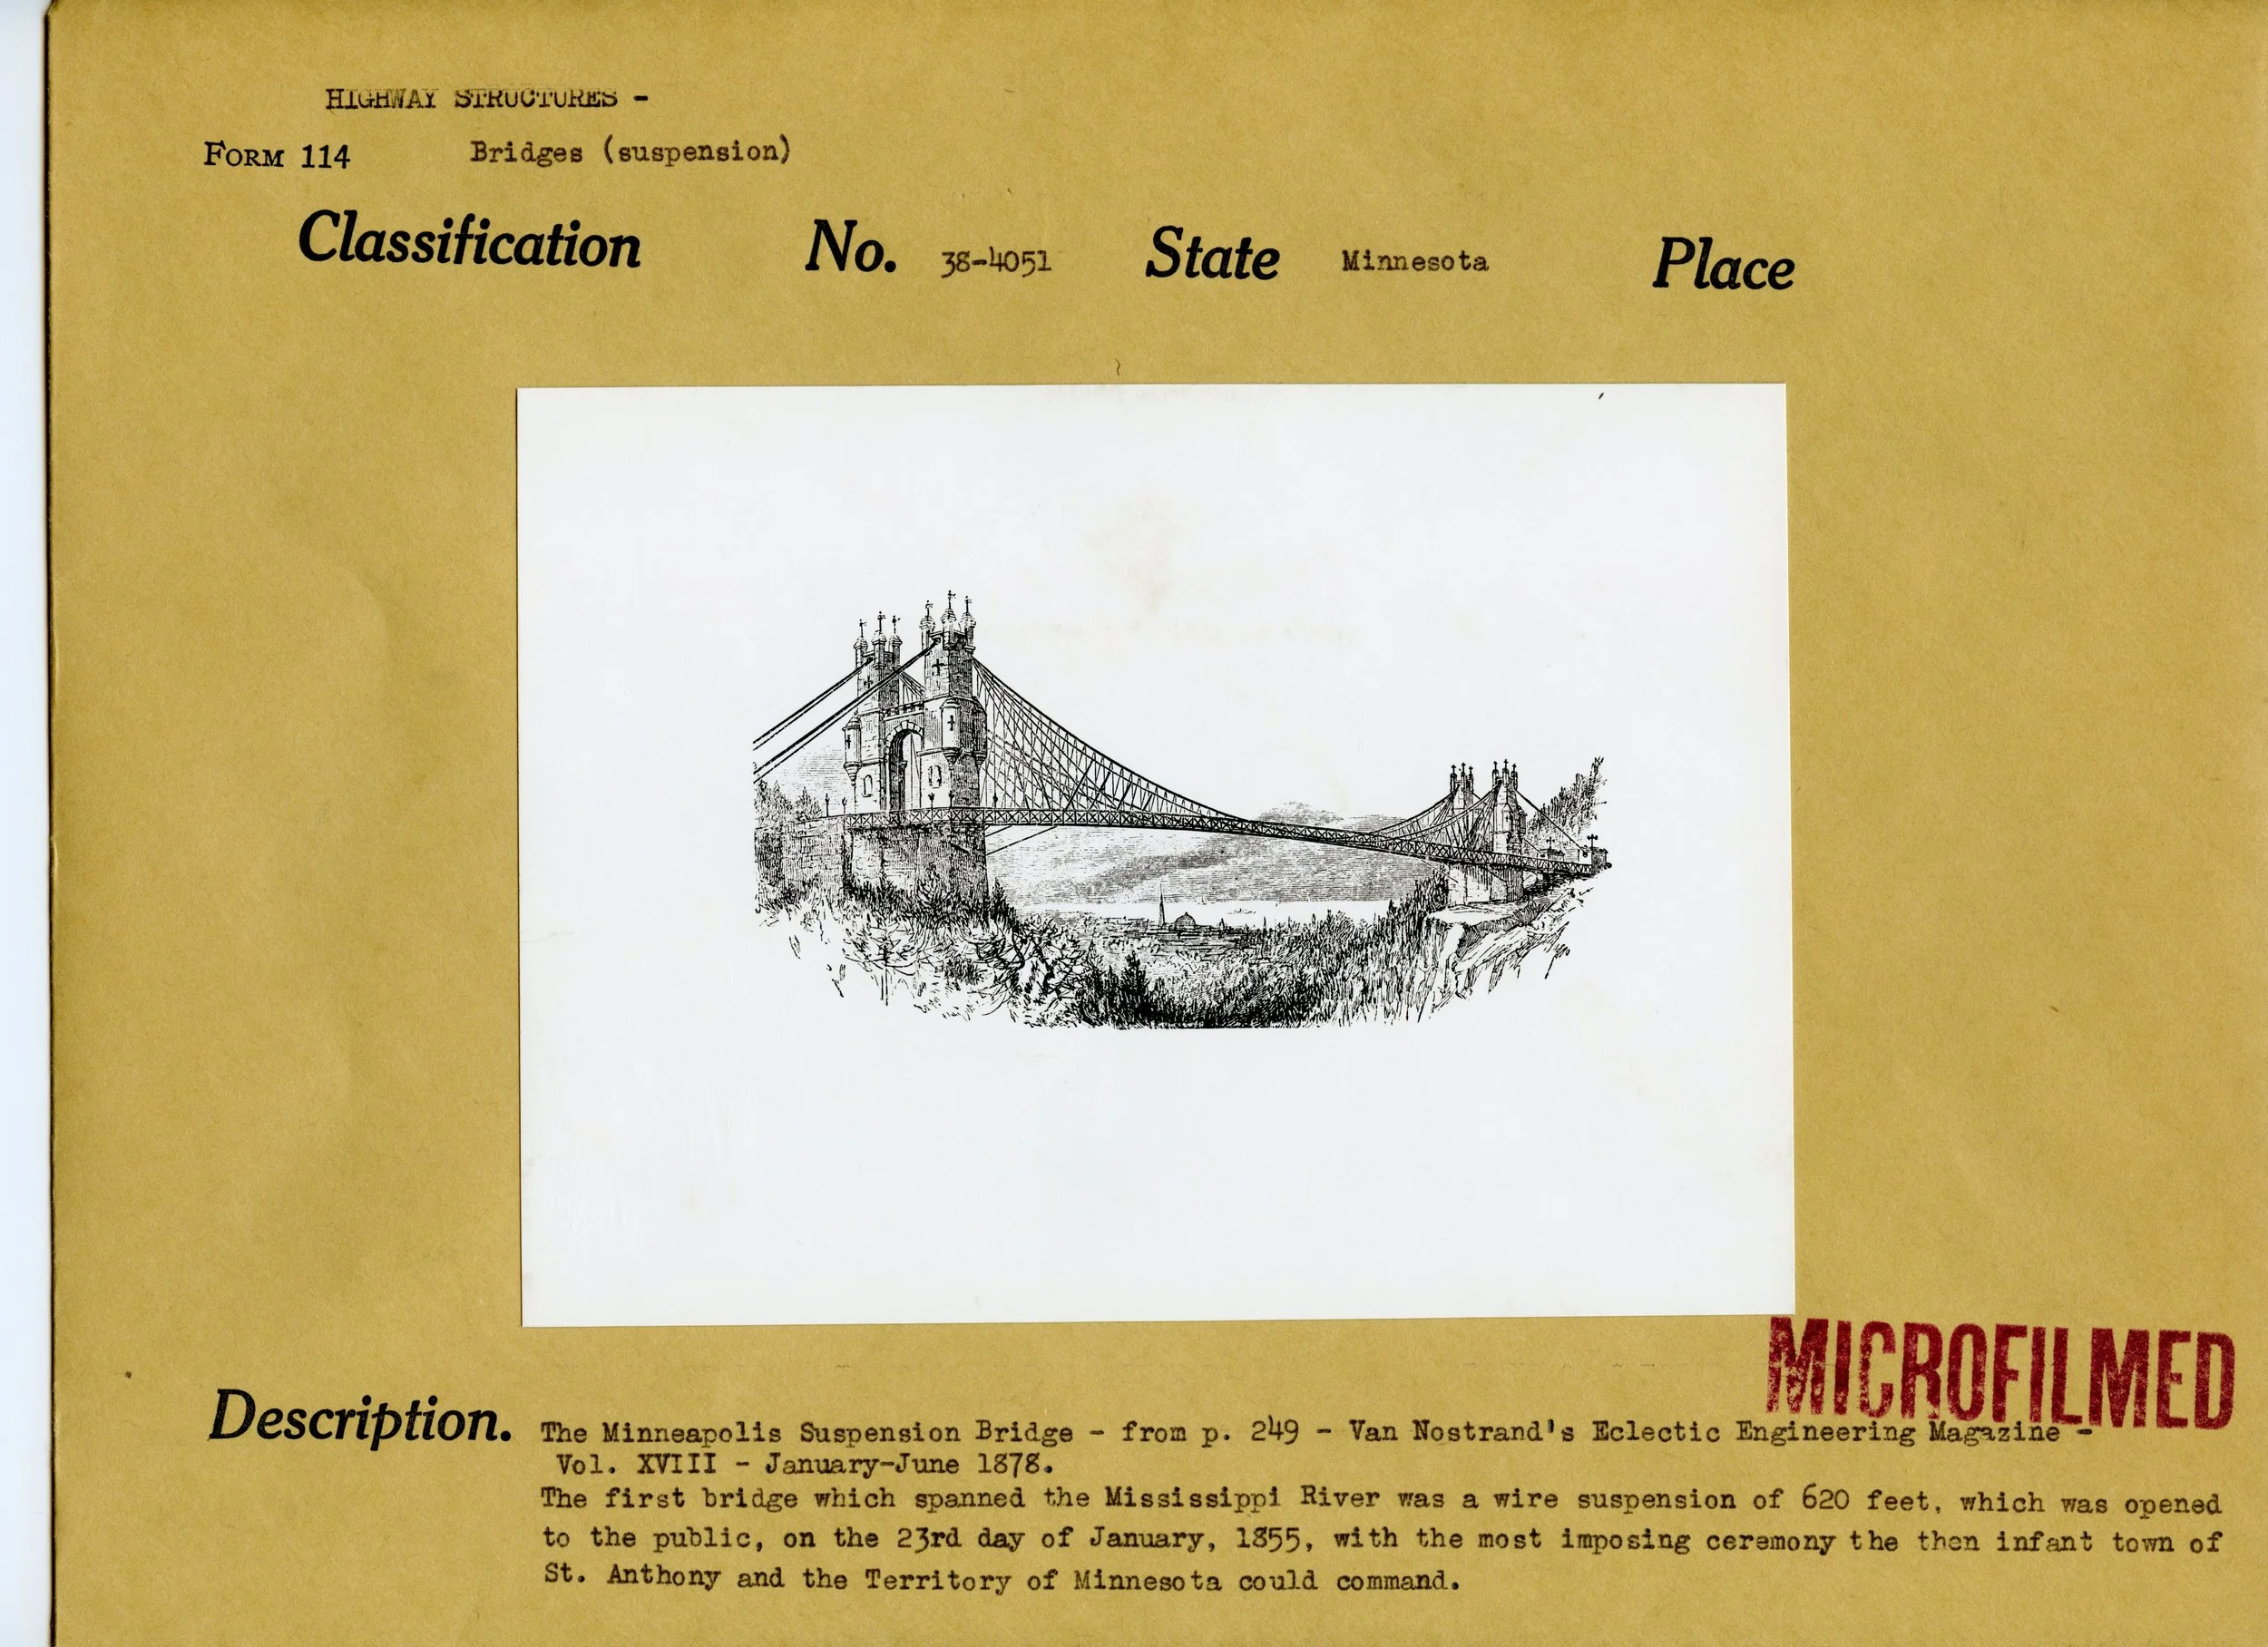
pig iron was the base unit of material that made the industrial era possible with the scale and complexity of building that the structural rigidity of processed ore made possible.
What the same event did on the other side of the planet
Here's the part that turns a good local story into an actual lesson about systems: at the exact same moment the upper Mississippi was having a false spring, the opposite was happening in the tropics. India's monsoon failed. Drought spread across China, Brazil, parts of Africa. What followed is now considered one of the deadliest famines in recent history. Same event but expressing elsewhere as a catastrophic drought.
That's the shape of how these systems resolve. There's a term for it: teleconnection. The meaning is that distant parts of a system are wired together in ways invisible from any single point inside it. A thermal energy release doesn't send the same instruction everywhere. It travels through whatever structure is already there: ocean currents, prevailing winds, the specific geography of a place, and comes out locally however that structure relates, its relativity. Minnesota's position in that structure made it warm. India’s geography made it dry. Neither region caused what happened to the other, and neither one, standing inside its own version of the event, had any way of knowing the other's was even underway.
The echo to present
None of this is only historical. NOAA issued an El Niño Advisory in June 2026, and by July the major forecasting bodies—NOAA, ECMWF, Australia's BOM—had converged on a consensus peak of roughly 3.6°C in the Niño 3.4 region by late 2026. The 1877–78 event, by comparison, peaked around 2.73°C—a near-exact statistical tie with 2015–16 for the modern record. The current forecast sits meaningfully above both. It's also developing faster than 1997–98, the previous benchmark for explosive onset.
Layer the AI capital cycle on top of it and the timing sharpens further. 2026 hyperscaler capex is confirmed around $725 billion, up roughly 64% year over year. Still expanding, not contracting. But the growth rate is expected to decelerate hard: 76% this year, an estimated 25% in 2027, and just 6% by 2028, with energy and cooling constraints named explicitly as a factor that could throttle deployment regardless of demand. Meanwhile a University of Hawaii study, published in Scientific Reports in June 2026, found that rising heat and humidity are already narrowing the number of hours per year operators can rely on "free cooling" — pulling in outside air instead of running mechanical chillers, historically one of the cheapest ways to run a data center, capable of cutting cooling energy by more than 70% in the right climate. A cost advantage a lot of the industry built its site-selection strategy around is quietly eroding at almost exactly the moment capital has started asking harder questions about unit economics.
Systems, not just weather
The 1877 window teaches that it isn't simply "extreme climate activity causes economic damage." The trains ran. The pig iron numbers didn't plummet. What actually moved was narrower and more specific: the railroads' winter monopoly on freight shortened in a season when nobody was watching for it. a structural advantage, barely noticeable in the moment, though evident in long range data. The headlines weren’t screaming about it in 1877 like they have been on my timeline. We don’t know where this climate event will affect us this winter, but it is seeming increasingly likely to do so somewhere.
Professor Mankin had a line that’s been sticking with me since I’ve listened to the podcast.
"...that geography means that it has flavors associated with it. And so these flavors mean that different parts of the tropical Pacific warm differently and look anomalously different. And so not every El Niño is the same."
There’s no way to tell how the weather will affect the local happenings nor the macroeconomy this upcoming season, but it there is a historically measured event happening that we know has global effects. While we don’t know where, we do know that unusual events will affect certain parts of this planet in unexpected ways, and those bursts of energy will affect human activity as it ripples out. My work involves anticipating sentiment across populations. While there isn’t a crystal ball telling me what is coming down the line, there are patterns you can look out for that indicate which direction the wind is likely to be blowing, and using that indicator to steer the position of a system to be best situated to not get toppled when wind clatters in. That’s what I believe the power of brand to be. It aligns the structure of an organization around an idea, which can be steered, like a ship in the wind.
I don't have a resolved answer yet for what an organization does with that kind of reading, beyond staying legible to itself while the ground under it changes—which is a different, harder thing than reacting quickly. That's where I'll pick this up next.
What this teaches, past the story itself
Pressure builds somewhere and when it releases it doesn't discharge evenly. It finds the channel that already exists and expresses through it. Differently, sometimes oppositely, depending entirely on the local structure it's moving through. This is true for both climate and brand.
I don't think that's only true of oceans. An organization builds its own version of those six quiet years: a strategy drifting slowly out of step with what a market actually wants, small unaddressed tensions accumulating in a culture, a customer base's patience wearing down in ways no dashboard is built to catch. None of it shows up in the numbers while it's building. It shows up all at once, later, as whatever the local structure turns it into.
I've started thinking of a brand in this frame as a microclimate. I’m not talking about a message broadcast outward, but the specific local conditions that determine how a much larger pressure actually gets felt by the people standing inside it. Two organizations can sit under the exact same macro pressure and discharge it completely differently, the same way Minnesota and India metabolized the same ocean event into opposite weather. What determines the difference isn't the size of the pressure. It's the shape of the structure it's moving through. And shape has the capacity to be steered by design with purpose.
That’s the fullest picture I can string together at this point. I wish I had more time and energy to explore this even deeper, but even in this narrow glimpse it felt like an angle that felt worth contributing to the conversation. Yes, on one hand I also feel the fear that stems from the uncertainty of thinking about this, but I simultaneously am feeling an increased sense of connection, with planet, fellow people, and myself. I want to talk about this more and the only way through is to participate, and I want to participate by planning ahead. This seems like an urgent conversation I want to be having more of.
Yes, I use Claude to help with structuring and editing. The ideas are mine, and most of these words were typed by my own hands at my laptop—hopefully somewhere with a good view. I'm a human, and this is what I've chosen to share.
I write to open conversations, not settle them. We're up against measurable uncertainty right now, and also a brief chance to decide, together, what we carry forward from here. I want to participate in that conversation—paying attention to how the landscape shapes us more than we usually notice, and hoping that attention is useful to someone else too.
If anything here lands wrong, tell me. Leave a note in the comment box. I can't promise to resolve every tension that comes up, but I'll read it, and I'll take it seriously.
—Payson Wick
Sources
Minnesota DNR, "The Year Without a Winter: 1877-78" — https://www.dnr.state.mn.us/climate/journal/1877_1878_winter.html
Same DNR piece (mirror with the fuller Cheney/Tribune excerpts) — https://climateapps.dnr.state.mn.us/doc/journal/wint77_78.html
Deepti Singh et al., "Climate and the Global Famine of 1876–78," Journal of Climate (2018) — https://journals.ametsoc.org/view/journals/clim/31/23/jcli-d-18-0159.1.xml
Wikipedia, "1877–1878 El Niño event" — https://en.wikipedia.org/wiki/1877–1878_El_Niño_event
Wikipedia, "Great Famine of 1876–1878" — https://en.wikipedia.org/wiki/Great_Famine_of_1876–1878
Mark Seeley, "1878 El Niño Saw Crops Planted in February," Farm Progress — https://www.farmprogress.com/commentary/1878-el-ni-o-saw-crops-planted-in-february
FRED/NBER, Pig Iron Production series — https://fred.stlouisfed.org/series/M0130AUSM561NNBR
FRED/NBER, Railroad Gross Earnings series — https://fred.stlouisfed.org/series/M035BBUSM144NNBR
Yale Climate Connections, "This could be the strongest El Niño on record" (July 2026) — https://yaleclimateconnections.org/2026/07/this-could-be-the-strongest-el-nino-on-record/
Karamperidou et al., "Limitations to air free cooling in data centers under rising heat and humidity," Scientific Reports (2026) — https://www.nature.com/articles/s41598-026-56926-3
Gizmodo, "The Cheapest Way to Cool Data Centers Won't Work in a Warmer World" — https://gizmodo.com/the-cheapest-way-to-cool-data-centers-wont-work-in-a-warmer-world-2000785402
Global Banking and Finance, "Among AI Crowd, Investors Position for Slower Hyperscaler Spending" (UBS capex figures) — https://www.globalbankingandfinance.com/analysis-among-ai-crowd-investors-position-slower/
NOAA Climate Prediction Center, "ENSO: Recent Evolution, Current Status and Predictions," updated August 17, 2026. https://www.cpc.ncep.noaa.gov/products/analysis_monitoring/lanina/enso_evolution-status-fcsts-web.pdf
Chris Bianchi, "NOAA predicts strongest El Niño on record: How might it impact Colorado's winter," 9NEWS. https://www.9news.com/article/weather/weather-colorado/strong-el-nino-colorado-winter-snow/73-4c8112ab-2d0f-464c-ae9a-04a5cc9307dc
Tracy Alloway and Joe Weisenthal, "A Historic El Niño Is Coming That Could Cost the World Trillions," Odd Lots(Bloomberg), August 14, 2026, featuring Justin Mankin. https://www.bloomberg.com/news/articles/2026-08-14/a-historic-el-nino-is-coming-that-could-cost-the-world-trillions
University of Minnesota Libraries, digital gallery. https://gallery.lib.umn.edu/files/original/89ac95f10d8bfc2ad8e1d6f655bd136c.pdf
Book references (no single citable URL, standard bibliographic citation instead):
Mike Davis, Late Victorian Holocausts (Verso, 2001)
William Strauss and Neil Howe, The Fourth Turning (Broadway Books, 1997)